MSP uptime monitoring is not just "monitor more endpoints." The operating challenge is multi-tenant reliability: many customers, shared on-call rotations, different SLAs, and high expectations for communication speed.
This playbook gives MSP and agency teams a practical framework to reduce alert noise, improve response speed, and deliver client-facing reliability outcomes consistently.
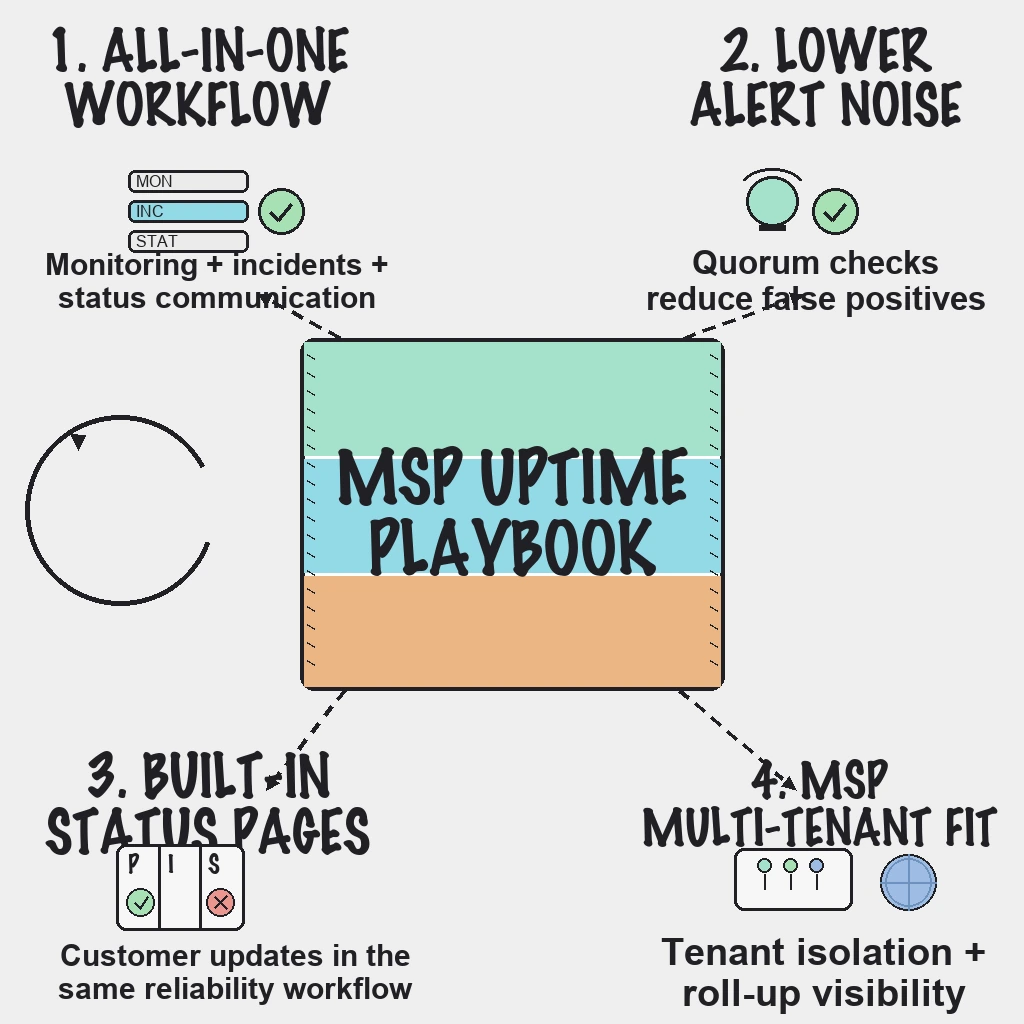
Why MSP Monitoring Is Operationally Different
Single-product SaaS monitoring and MSP monitoring are not the same discipline. MSP teams usually need:
- Tenant isolation: Monitors, incidents, and notification policies separated by customer.
- Portfolio visibility: Roll-up views to spot risk across all managed accounts.
- SLA-aware escalation: Different priorities and response targets per contract tier.
- Client-ready communication: Clear status updates per tenant during incidents.
Without this structure, teams get alert overload, inconsistent incident handling, and avoidable churn risk during visible outages.
A 90-Day MSP Rollout Plan
Use this phased approach to improve reliability operations without overhauling everything at once.
Phase 1 (Weeks 1-3): Standardize Monitor Baselines
Define a baseline monitor pack for every tenant:
- Core website/API uptime checks
- Synthetic checks for high-value journeys
- SSL and DNS checks for customer-facing properties
- Standard tags for owner, severity, region, and SLA tier
The goal is consistent coverage before advanced optimization.
Phase 2 (Weeks 4-7): Enforce Alert Governance
Alert quality is the biggest MSP time sink. Set hard rules:
- Use quorum or multi-region confirmation where possible.
- Deduplicate repeated failures into one actionable incident.
- Route alerts by tenant ownership and severity policy.
- Suppress alerts during approved maintenance windows.
This is where most teams recover on-call focus quickly.
Phase 3 (Weeks 8-12): Add Customer-Ready Incident Communication
Reliability is only half the experience. Communication quality determines trust.
- Publish tenant-specific status pages with clear component naming.
- Use short update cadence (for example every 20-30 minutes in major incidents).
- Include impact, current action, and next update time.
- Close incidents with plain-language post-resolution summaries.
For implementation details, use status page best practices.
MSP Metrics That Actually Improve Operations
Track metrics that change behavior, not vanity dashboards:
- MTTA (acknowledgement time): Detects triage bottlenecks.
- MTTR (restore time): Core recovery performance metric.
- False positive rate: Direct indicator of alert quality debt.
- SLA attainment by tenant: Commercial reliability outcome.
- Communication latency: Time from incident creation to first public update.
If you run QBRs with clients, convert these into trend views month-over-month and quarter-over-quarter.
Reader Questions, Answered
What is the first thing an MSP should fix in monitoring?
Alert quality. High false-positive volume burns on-call capacity and delays real incident response.
Should each tenant have a separate status page?
Usually yes. Tenant-specific status communication is clearer and avoids cross-customer confusion during incidents.
How often should MSP teams review monitor coverage?
At least monthly, plus after major incidents. Coverage should follow service changes and new critical journeys.
Wrap Up
MSP reliability improves fastest when you treat monitoring as an operating system: standard coverage, governed alerting, and client-grade communication.
Ready to run multi-tenant reliability operations with less noise and stronger client trust?
Start your free trial on PingAlert
Related guides:
- Website monitoring for agencies
- Client reporting for agencies
- MSP SLA reporting for uptime monitoring
- White-label status pages for agencies
- Global website uptime monitoring
- How synthetic monitoring helps
- Mastering uptime for business growth